Hello! Tom here.
Recently, I visited Miraikan, the National Museum of Emerging Science and Innovation in Odaiba, Tokyo, with my family.
We had our baby with us, so we knew from the start that we wouldn’t be able to spend hours carefully exploring every single exhibit. Our approach was simple: stop at whatever caught our attention, enjoy it for as long as we could, and move on when necessary. We skipped some of the longer video installations altogether.
But this visit turned out to be much more interesting than I had expected.
The reason is that I’m currently studying meteorology.
Saturation vapor pressure, adiabatic processes, atmospheric stability, condensation, latent heat…
When I study these concepts in a textbook, I tend to focus on understanding the terminology and equations. They can easily remain abstract pieces of knowledge that exist only on the page.
But as I walked through Miraikan, I kept having moments when I thought:
“Wait, I’ve studied this.”
Or:
“So this is where that concept connects to the real world.”
It felt as though the knowledge that had been sitting still inside my textbook had suddenly started moving.
So rather than writing a typical museum review, I want to write about how Miraikan looked to me through the eyes of someone studying meteorology.
- “The World Is Made of Waves”
- Is a 1.5°C Rise Really That Significant?
- Suddenly, “Saturation Vapor Pressure” Felt Real
- I Followed the Rolling Balls—and Saw the Water Cycle
- When Water Moves, Energy Moves Too
- It Isn’t Just Water—Carbon and Resources Circulate Too
- If We Can Predict a Typhoon, Is That Enough to Save Lives?
- Even a Rocket Made Me Think About Pressure, Temperature, and Expansion
- At the Entrance to the Universe, I Found Kenji Miyazawa
- Seeing, Hearing, Capturing—and Recreating—the Universe
- Meteorology Has Become a Lens for Seeing the Earth
“The World Is Made of Waves”
One of the first exhibits that caught my attention was on the third floor: “The World Is Made of Waves.”
The exhibit used a two-dimensional Fourier transform to represent an image as a combination of different waves.
Normally, when we look at a photograph, we recognize shapes and objects.
“There’s a person.”
“That’s a building.”
“That’s a landscape.”
Mathematically, however, the same image can be decomposed into waves with different spatial frequencies. Combine those waves again, and the original image can be reconstructed.
I found it fascinating that something we normally perceive as a collection of shapes could be represented in such a completely different way.
The same world can look entirely different depending on how we choose to describe it.
Studying meteorology has made me feel something similar.
Before, I might have looked outside and simply thought, “It’s sunny today,” or “The wind is strong.”
Now, the atmosphere increasingly looks like a constantly changing system of pressure, temperature, density, water vapor, and wind, all interacting across space and time.
Right at the beginning of my visit, Miraikan had already made me think about something fundamental:
There is more than one way to see the world.
Is a 1.5°C Rise Really That Significant?
On the fifth floor, we visited an exhibition called “Planetary Crisis.”
It explores climate change, global warming, ecosystems, carbon dioxide, and the various environmental changes now taking place across the planet.
One number immediately stood out:
1.5°C.
In everyday weather, a temperature difference of 1.5°C doesn’t sound particularly dramatic.
If tomorrow is 1.5°C warmer than today, most of us probably wouldn’t think much of it.
So why does a 1.5°C increase in global average temperature matter so much?
The exhibition showed how warming can affect events such as:
- extreme heat that historically occurred once every ten years,
- heavy rainfall events,
- droughts,
- and intense tropical cyclones.
What struck me was that climate change is not simply about the world becoming “a little warmer on average.”
When the average state of the climate changes, the probabilities of extreme events can change as well.
An event that used to be considered rare does not necessarily remain equally rare in a warmer climate.
A seemingly modest shift in the average can have much larger implications at the extremes of the distribution.
After seeing the exhibit, the familiar number “1.5°C” started to look very different to me.
Suddenly, “Saturation Vapor Pressure” Felt Real
The connection became especially clear when I started thinking about heavy rainfall.
One of the concepts I have been studying recently is saturation vapor pressure.
As temperature increases, saturation vapor pressure also increases, meaning that warmer air can potentially contain more water vapor.
Then imagine moist air rising.
As it rises, the surrounding atmospheric pressure decreases.
The air expands and cools.
Eventually it reaches saturation.
With further cooling, water vapor condenses and cloud droplets begin to form.
In a textbook, the sequence looks something like this:
Rising → Expansion → Cooling → Saturation → Condensation
Of course, this does not mean that higher temperatures automatically produce heavy rain.
Actual rainfall depends on many factors: atmospheric stability, upward motion, moisture transport, fronts, low-pressure systems, typhoons, and more.
Still, the amount of water vapor available in the atmosphere is an important part of understanding how a warming climate can influence heavy precipitation.
When I first studied saturation vapor pressure, part of me was simply thinking:
“I need to understand this because it might be on the exam.”
But standing in front of the climate exhibits at Miraikan, I suddenly thought:
“This is not just a textbook concept. This is actually happening in the atmosphere around us.”
Something I had learned as terminology and equations suddenly became connected to real weather and climate.
I Followed the Rolling Balls—and Saw the Water Cycle
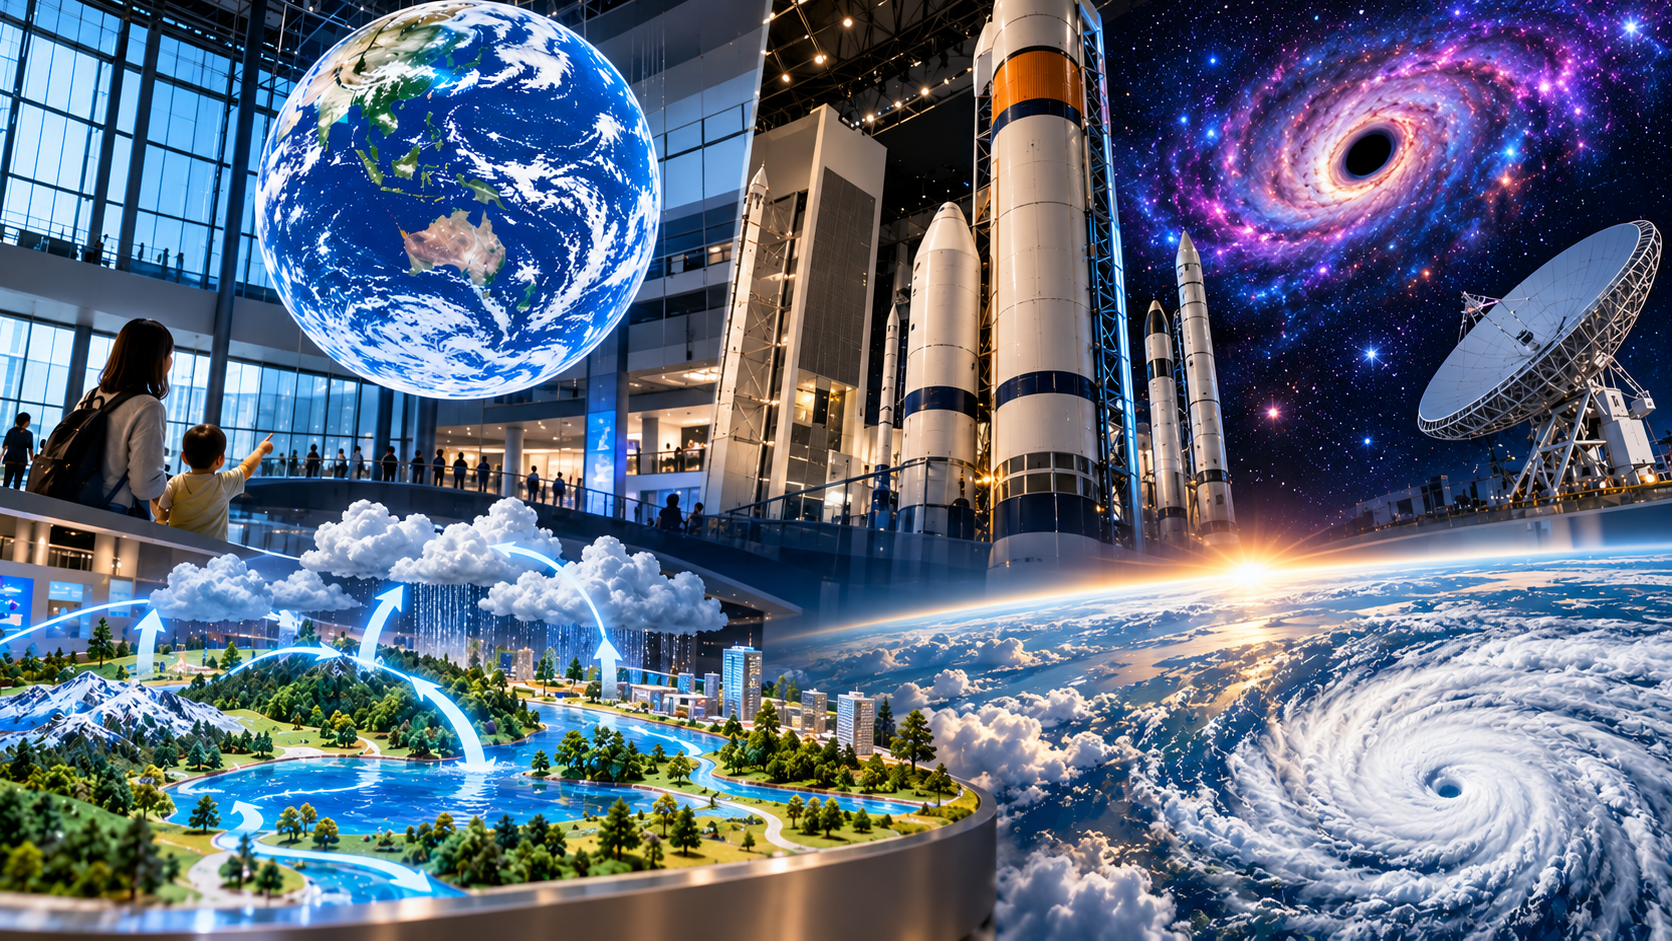
One of my favorite exhibits of the entire visit was a large physical model representing the Earth.
It included oceans, forests, the atmosphere, cities, and other parts of the environment.
And all around it, balls rolled from one place to another.
At first, I simply watched them and thought:
“This is fun.”
Then I started following their paths.
From the ocean to the atmosphere.
From the atmosphere to the forest.
Through rivers and across the land.
And eventually back to the ocean.
Then it clicked.
This was the water cycle.
In a textbook, it might appear as a simple diagram:
Ocean → Evaporation → Atmosphere → Condensation → Clouds → Precipitation → Rivers and Groundwater → Ocean
At Miraikan, that diagram had become a large three-dimensional system with objects physically moving through it.
I had known about the water cycle long before I started studying meteorology.
But now, when I watched those balls moving around the model, I could see something else moving with them.
Energy.
When Water Moves, Energy Moves Too
When water evaporates from the ocean surface, it absorbs energy from its surroundings.
Water vapor carries that energy in the form of latent heat.
Later, when the water vapor condenses in the atmosphere, that latent heat is released back into the air.
In other words:
Water vapor transports energy from the ocean into the atmosphere.
This process is important when thinking about phenomena such as cumulonimbus clouds and tropical cyclones.
“Latent heat” sounds exactly like the kind of technical term you would expect to memorize for an exam.
But in reality, it is part of a massive mechanism that transports energy around the planet.
In front of me, all I could physically see were balls moving from the ocean toward the sky.
But once I imagined those balls as water molecules, I realized that they represented more than the movement of water.
They also represented the movement of energy.
This may have been the moment when my meteorology studies and the Miraikan exhibits connected most clearly.
It Isn’t Just Water—Carbon and Resources Circulate Too
The exhibits weren’t limited to the water cycle.
Another section showed carbon dioxide moving between the atmosphere, forests, oceans, and other parts of the Earth system.
Then the focus shifted toward human society.
Resources become materials.
Materials go into factories.
Factories make products.
Products enter cities.
They are collected.
Some are recovered as resources.
And ideally, those resources become products again.
One section on circular manufacturing included ideas such as plastics made from plant-derived materials and new industries based on wood and biomass.
One phrase in particular stayed with me:
“Ore sleeping beneath the city.”
Think about smartphones, appliances, cars, and buildings.
Our cities already contain enormous amounts of metals and other valuable materials.
So instead of thinking only about digging new resources out of the ground, we can also think of the city itself as a kind of mine.
Water circulates through nature.
Carbon circulates through the Earth system.
So could we design human manufacturing to circulate resources as well?
Suddenly, the natural cycles I had just been looking at and the way we design industrial society started to feel connected.
If We Can Predict a Typhoon, Is That Enough to Save Lives?
Next, we visited an area focused on hazards and protecting human life.
The exhibits covered not only natural hazards such as earthquakes, volcanic eruptions, and heavy rainfall, but also other risks including infectious diseases and nuclear accidents.
There was another large model here, with mountains, oceans, cities, factories, and ships.
And once again, balls rolled through the system.
What interested me was that the exhibit did not treat a hazard such as a typhoon as an isolated event.
Imagine a powerful typhoon approaching.
A port shuts down.
Ships stop moving.
Parts do not arrive.
Factories stop production.
The effects spread to places far from the original storm.
In a modern world where people, goods, and information are deeply interconnected, the consequences of a hazard can propagate through networks as well.
The exhibition also presented five steps for protecting lives: recognizing potential dangers, understanding the hazard, preparing for disasters, reducing damage, and learning from past experience.
It made me wonder:
If we could predict the weather perfectly, would that alone be enough to save lives?
Weather prediction is obviously essential.
We need to know when rain will fall, where it will fall, and how intense it may become.
But prediction alone is not enough.
We also need to translate that information into decisions:
“This amount of rain could cause this river to flood.”
“This area may face a landslide risk.”
“People here should evacuate before conditions worsen.”
Scientific information about the atmosphere has to be transformed into information that people can act on.
Meteorology therefore connects directly with disaster prevention and public decision-making.
Understanding the weather is one thing.
Using that understanding to protect people is another.
That distinction stayed with me.
Even a Rocket Made Me Think About Pressure, Temperature, and Expansion
Then, suddenly, we were standing in front of a huge rocket engine.
It was the LE-7A, the main engine used on the first stage of Japan’s H-IIA rocket.
My first reaction was simple:
It was enormous.
The turbopump, pipes, and countless components made the engine itself look incredibly complicated.
But when I looked at a diagram of the entire H-IIA and H-IIB launch vehicles, I had almost the opposite reaction.
The overall concept looked surprisingly simple.
There is propellant.
There is an engine.
There are multiple stages.
And the payload sits on top.
The basic idea can be explained fairly simply, while actually engineering a machine capable of doing it reliably is extraordinarily difficult.
I loved that contrast.
And perhaps because I have been studying meteorology, even a rocket engine made me think about:
pressure, temperature, expansion, and energy.
Inside a rocket engine, hot, high-pressure gas expands and accelerates through a nozzle to produce thrust.
In meteorology, when an air parcel rises into regions of lower pressure, it expands and cools through an adiabatic process.
Of course, a rocket nozzle and an air parcel in the atmosphere are not the same phenomenon.
But both ultimately lead us back to the physics of pressure, temperature, expansion, and energy.
I hadn’t expected studying meteorology to change the way I looked at a rocket engine.
But apparently it had.
At the Entrance to the Universe, I Found Kenji Miyazawa
The last exhibition we visited was “The Unread Universe.”
This section was wonderful.
I expected an exhibition about the universe to begin with something like the Big Bang, galaxies, or black holes.
Instead, at the entrance, I encountered the Japanese poet and writer Kenji Miyazawa and his work Spring and Asura.
One phrase particularly caught my attention:
“I, as a phenomenon.”
I loved this.
Before asking what the universe is, the exhibition seemed to ask:
What exactly is the “I” that is observing this universe?
A science museum beginning its space exhibition with literature—and with words written more than a century ago—felt unexpectedly poetic.
It gave the whole exhibition a sense of wonder before I had even entered.
Seeing, Hearing, Capturing—and Recreating—the Universe
Inside, the exhibition explored the different ways humans attempt to understand a universe that cannot be perceived through our ordinary senses alone.
We use electromagnetic radiation to see the universe.
We detect gravitational waves and translate the data into forms we can hear.
We build enormous detectors to capture neutrinos, particles that pass through ordinary matter with very little interaction.
And with particle accelerators, we collide particles at extremely high energies to recreate, in a limited way, physical conditions relevant to the early universe.
I found this progression fascinating.
The universe visible to our naked eyes is only a tiny fraction of what can be observed.
So humans have built radio telescopes, gravitational-wave detectors, neutrino observatories, particle accelerators, and countless other instruments.
Perhaps science can be thought of as an effort to extend the human senses so that we can perceive worlds that were previously invisible to us.
If we cannot see something, we observe it at another wavelength.
If we cannot hear it, we detect it and translate the data into sound.
If a particle almost never interacts with matter, we build an enormous detector and wait.
If we cannot travel back to the early universe, we create extreme conditions in a laboratory and study what happens.
Human beings go to extraordinary lengths just to answer one question:
How does the world actually work?
I find that rather wonderful.
Meteorology Has Become a Lens for Seeing the Earth
During this visit to Miraikan, we explored an enormous range of subjects:
Quantum computers.
Rockets.
Climate change.
The water cycle.
Resource circulation.
Natural hazards.
And finally, the universe itself.
On the surface, these topics seem completely unrelated.
But by the time we were ready to leave, they somehow felt connected.
One reason was the meteorology I have been studying.
Before studying meteorology, I might have looked at that large water-cycle model and simply thought:
“Those balls rolling around are pretty cool.”
Now, as I watch them, different words come to mind:
Evaporation.
Adiabatic expansion.
Cooling.
Saturation.
Condensation.
Latent heat.
When I look at a rocket, I think about pressure and expansion.
When I look at climate change, I remember saturation vapor pressure.
When I look at a typhoon, I think not only about the atmospheric phenomenon itself but also about what happens afterward—warnings, evacuation, infrastructure, and disaster prevention.
And that led me to perhaps the biggest thing I took away from this visit:
Learning more does not simply mean knowing more words. It means being able to see more in the same landscape.
At the end of the day, I found myself thinking again about Kenji Miyazawa’s idea of “I, as a phenomenon.”
Water circulates.
Carbon circulates.
Energy moves.
The atmosphere interacts with the ocean.
Forests interact with the atmosphere.
And we humans live inside all of those relationships.
Nothing on Earth exists completely independently. Everything is interacting and changing.
Before I began studying meteorology, I thought of it mainly as the science used to forecast tomorrow’s weather.
Now I’m beginning to realize that it is much broader than that.
To understand the atmosphere, you need to understand water.
You need to understand the ocean.
You need to understand the energy coming from the Sun.
You need to think about the land surface and forests.
And eventually, you have to think about how changes in all of those systems affect human society.
Meteorology may be less a science for predicting the weather and more a lens through which we can understand the Earth as one enormous, interconnected system.
Because we were visiting with our baby, there were plenty of exhibits we couldn’t see this time.
We skipped some of the video installations, and I certainly didn’t fully understand every exhibit we did see.
But I think that was fine.
Maybe a science museum isn’t a place where you are supposed to understand everything before you leave.
You stop in front of one exhibit.
Something makes you wonder, “Why?”
It connects with something you already know.
And you leave wanting to learn a little more.
That alone is enough to make a science museum worth visiting.
When I come back after studying meteorology a little more, I wonder what I’ll be able to see that I couldn’t see this time.
I’m already looking forward to finding out.
See you next time!